Polling Matters
Explore Gallup's research.

Americans' personal satisfaction remains significantly higher than satisfaction with the way things are going in the U.S.

Americans' lessened confidence in society's institutions and norms may affect society's ability to deal with crucial external and internal threats.

Trends measuring Americans' values need to be analyzed in the context of differences in question wording and changes in methodology.

Despite declining fertility and marriage rates, Americans want to have children and to be married.

Recent Gallup data confirm a significant and growing relationship between religiosity and partisan identity in the U.S.
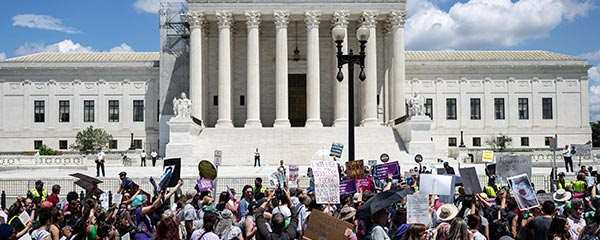
Recent Supreme Court decisions may have conflicting impacts on Americans' overall opinion of the court.

Survey researchers face the difficult challenge of meaningfully defining and measuring evangelicals in the U.S. today.

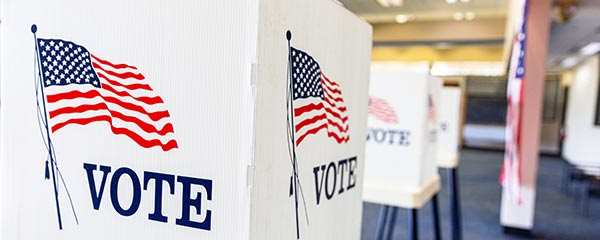
Knowing what the public is thinking and feeling between elections is an invaluable asset in a representative democracy.

Former U.S. President Jimmy Carter has been identified as an evangelical for most of his public career, but defining exactly what that means today faces a number of challenges.
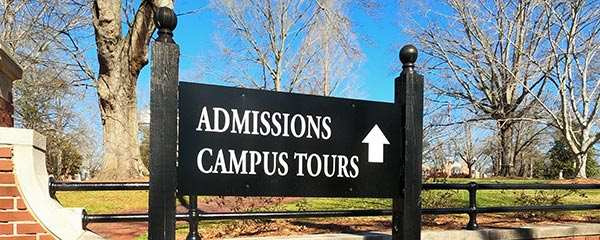
Americans value diversity in higher education but continue to oppose using race as a factor in college admissions.

Any new effort to reform healthcare will meet with significant challenges but should directly involve the views of the people themselves.

The percentage of Americans with no formal religious identity has increased dramatically since the 1950s, but that increase appears to have leveled off in Gallup's recent data.

Crime became an issue in the recent midterm elections, underscoring the importance of understanding what lies behind Americans' views of the issue.
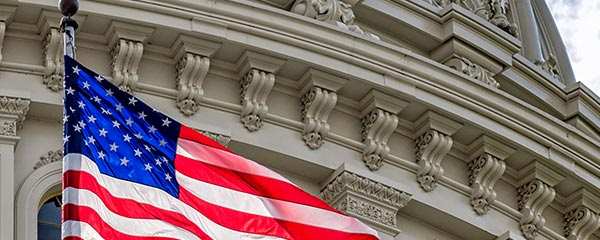
Americans' views about their federal government are complex and often paradoxical.
Read a review of where the American public stands on gun control, immigration, and climate change.
Where does the public stand on abortion, critical race theory and gender identity issues?

The economy and inflation are Americans' top concerns leading into the November midterm elections.

Despite reports of pandemic-era declines in test scores, parents of K-12 children remain just as satisfied with their children's quality of education as before.

While Americans' cigarette use is in steep decline, future changes in their use of marijuana and alcohol are uncertain.
The majority of Americans support higher taxes on the rich, as they have for years.